
YOU’VE BEEN GIVEN THE GREEN LIGHT! WELCOME TO MY WORK.
Genetic Alliance: GaugeRx
2023 (4 months) / University of Michigan Senior Capstone
COLLABORATORS
Ava Frank
Chris Hudson
Serena Wang
SKILLS
Prototyping
User Research
Visual Design
PROBLEM SPACE
Advocacy groups often collaborate with academic and industry researchers to provide information that can help accelerate drug development. However, it is difficult for researchers to know which of the thousands of diseases to prioritize in their own work.
SOLUTION
Our tool, called GaugeRx, will display relevant data on all available diseases to allow researchers and advocacy groups to better understand the readiness of a specific disease and its community to accelerate drug development. Scroll below to see key features and to the bottom to see the final prototype.
WHY IS THIS IMPORTANT TO SOLVE?
Every research entity has different goals and capabilities they consider when choosing what disease to research next. Drug development takes a long time and research is a critical part of a company’s profit and strategy. In an academic context, disease research is key for increasing an institute’s funding, prestige, and mission.
GaugeRx helps researchers discover propsective diseases to study by sorting through a database of diseases based on inputted priorities and capabilities.
FEATURES
Edit Search Criteria
View and edit the filtering critera from the results page, with the ability to minimize the dropdown menus to not overwhelm your search.
Discover What’s Missing
Hover over a disease card to uncover what specific criteria the disease doesn’t match up with, to help your decision-making process.
Interpret a Disease Card
Clicking into the popup provides a quick overview of the scoring methods used and what a disease card means to clear up any information and help you in your search.
Onboarding
Focus your specific search by entering step-by-step the criteria that is relevant to your research to generate results.
01 UNTANGLING THE PROBLEM SPACE
What does Genetic Alliance do?
A genetic disease advocacy organization.
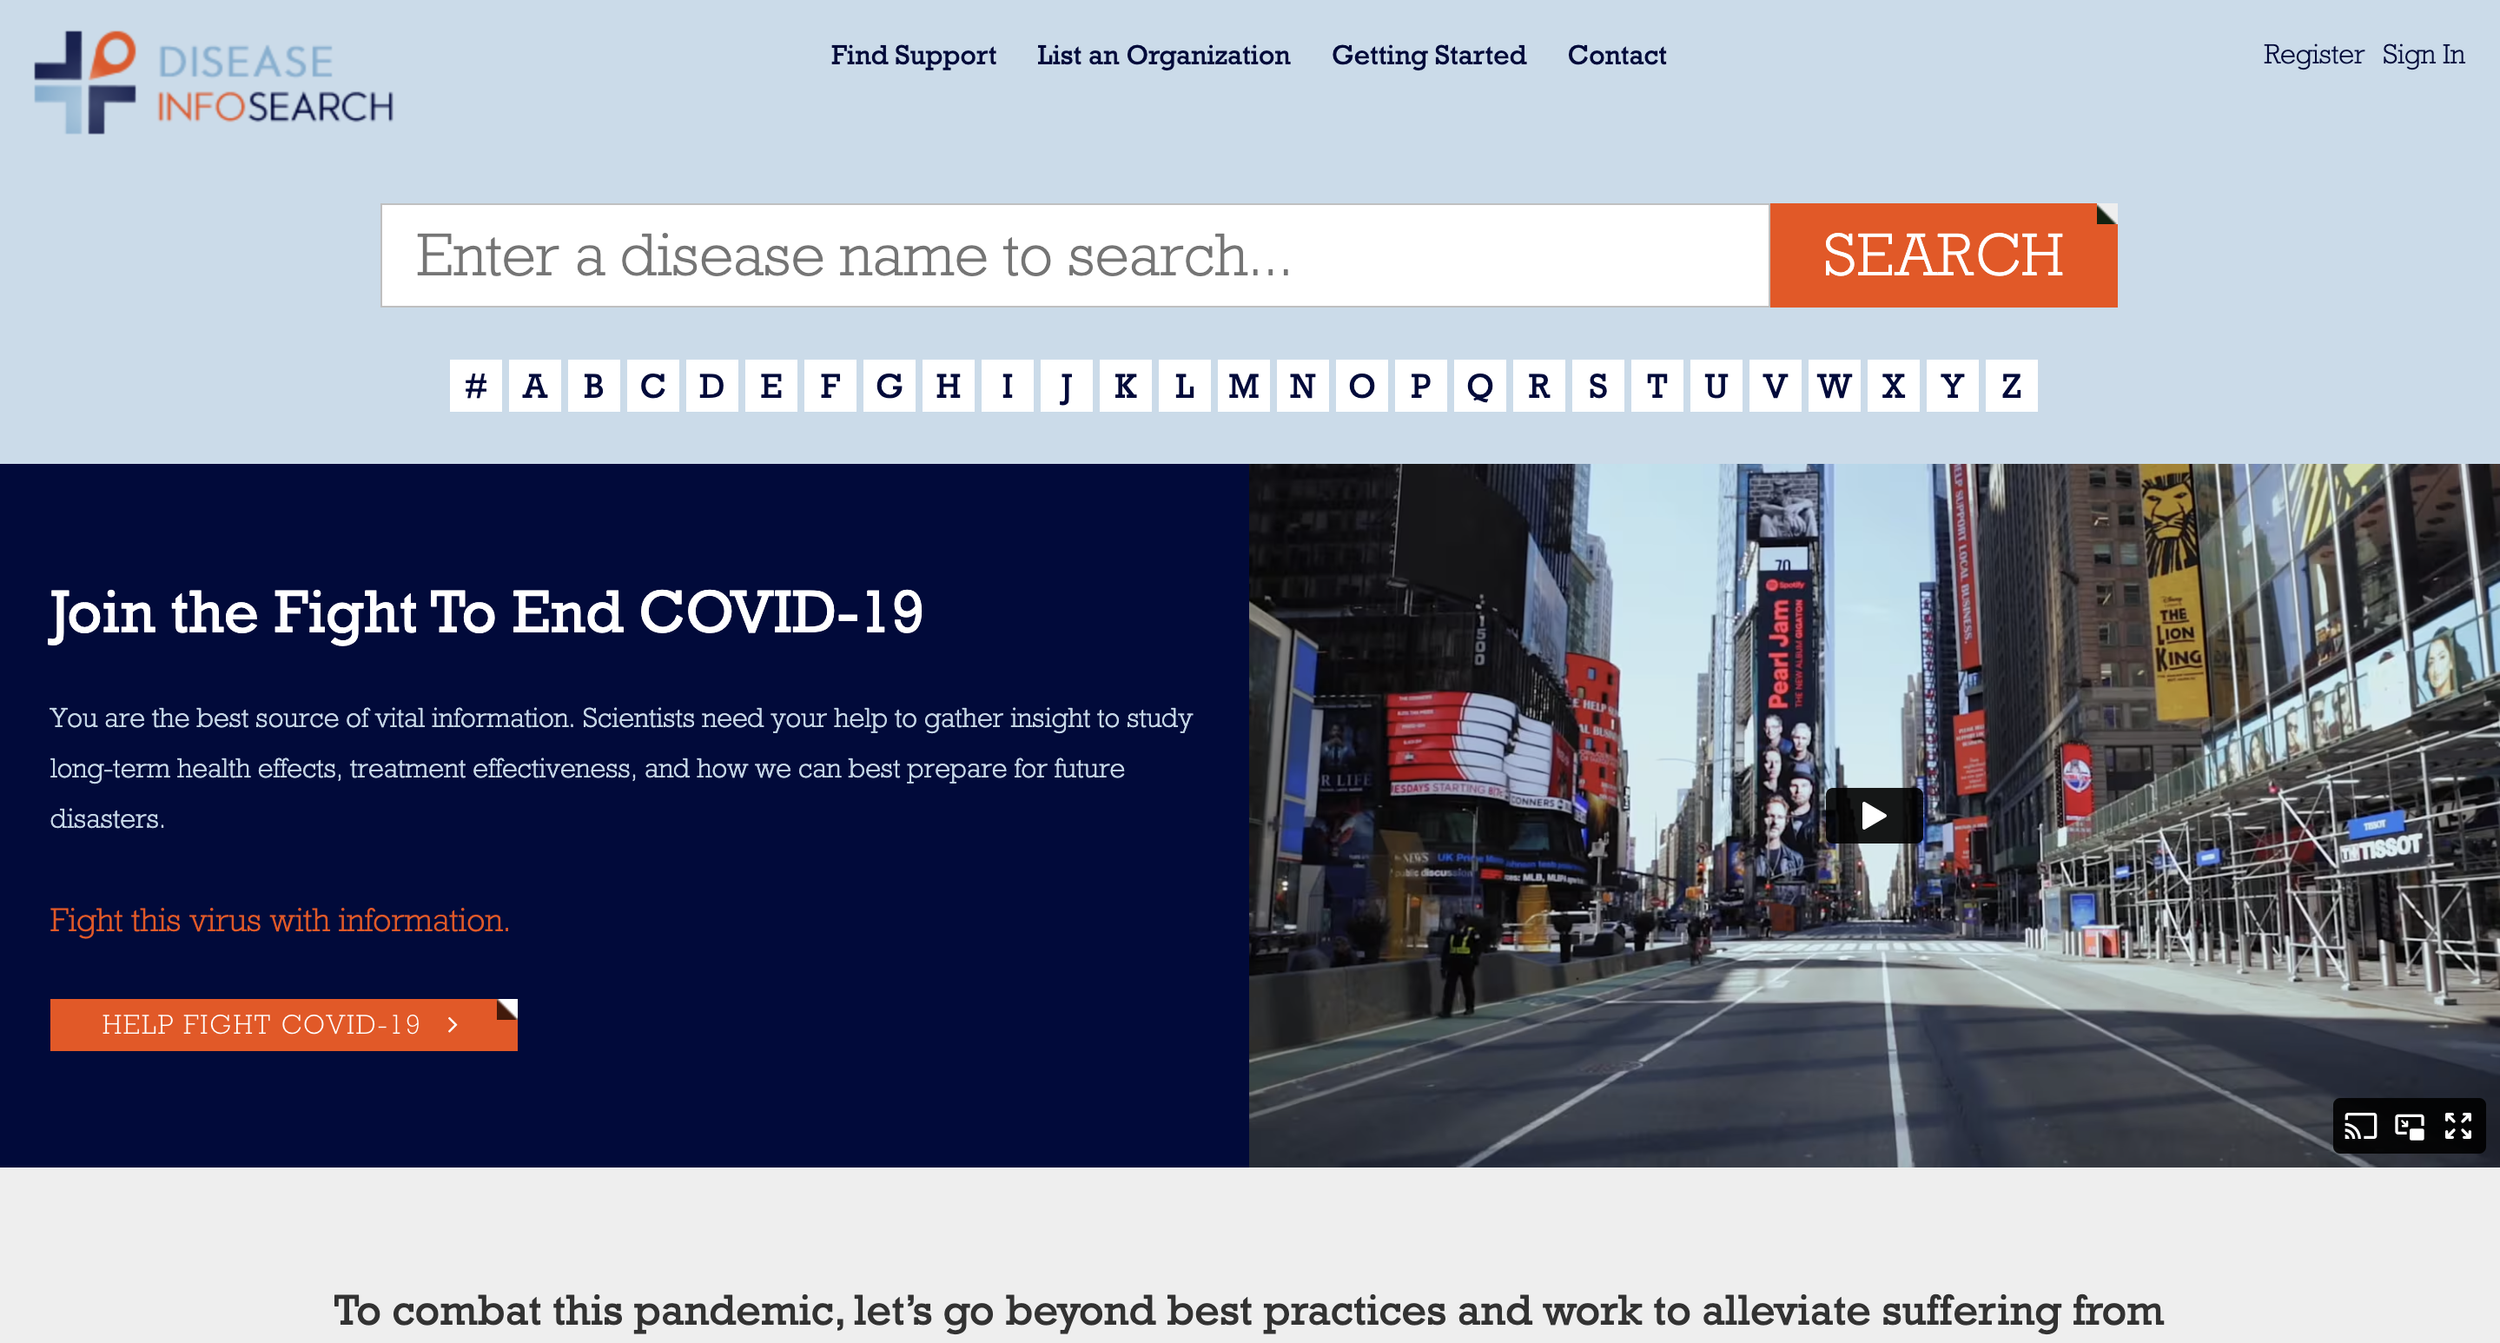
Genetic Alliance is a non-profit organization that provides resources and support to individuals, families, and communities affected by genetic diseases and to researchers studying those diseases.
They own and manage various tools, including DiseaseInfoSearch, a database containing information aggregated from a variety of resources including journal articles, clinical trials, and news and events. Disease InfoSearch serves as a resource for curated and crowdsourced disease information to help individuals access quality and credible information.
How does GaugeRx fit into Genetic Alliance?
A tool which filters through DiseaseInfoSearch’s database and displays relevant results.
GaugeRx will display relevant data on all diseases (using the data from DiseaseInfoSearch) that match a user’s preferences to allow researchers and advocacy groups to better understand the readiness of a specific disease and its community to accelerate drug development.
The goal is to develop a user-friendly tool that conveys information about how each disease corresponds to a user’s preferred criteria in a digestible format.
This helps researchers make decisions more quickly about what disease to research next by allowing them to more effectively sort through the database of diseases.
We’re in charge of creating a data-visualization tool, not a disease profile page.
A large portion of the workload for this project was setting expectations on what we could and could not design given the scope of the class. As full-time students, not full-time scientists, we made it clear to our client that we could only design based on the types of stakeholders we were able to interview.
Every scientist and researcher looks for different things in their respective process and we did not have time to interview enough to gain a rich and broad enough understanding of the different perspectives.
Research Goals
01
Figure out what information is crucial to display on GaugeRx to best accommodate the needs of researchers.
02
Uncover what is inhibiting researchers’ abilities to prioritize a disease for research.
03
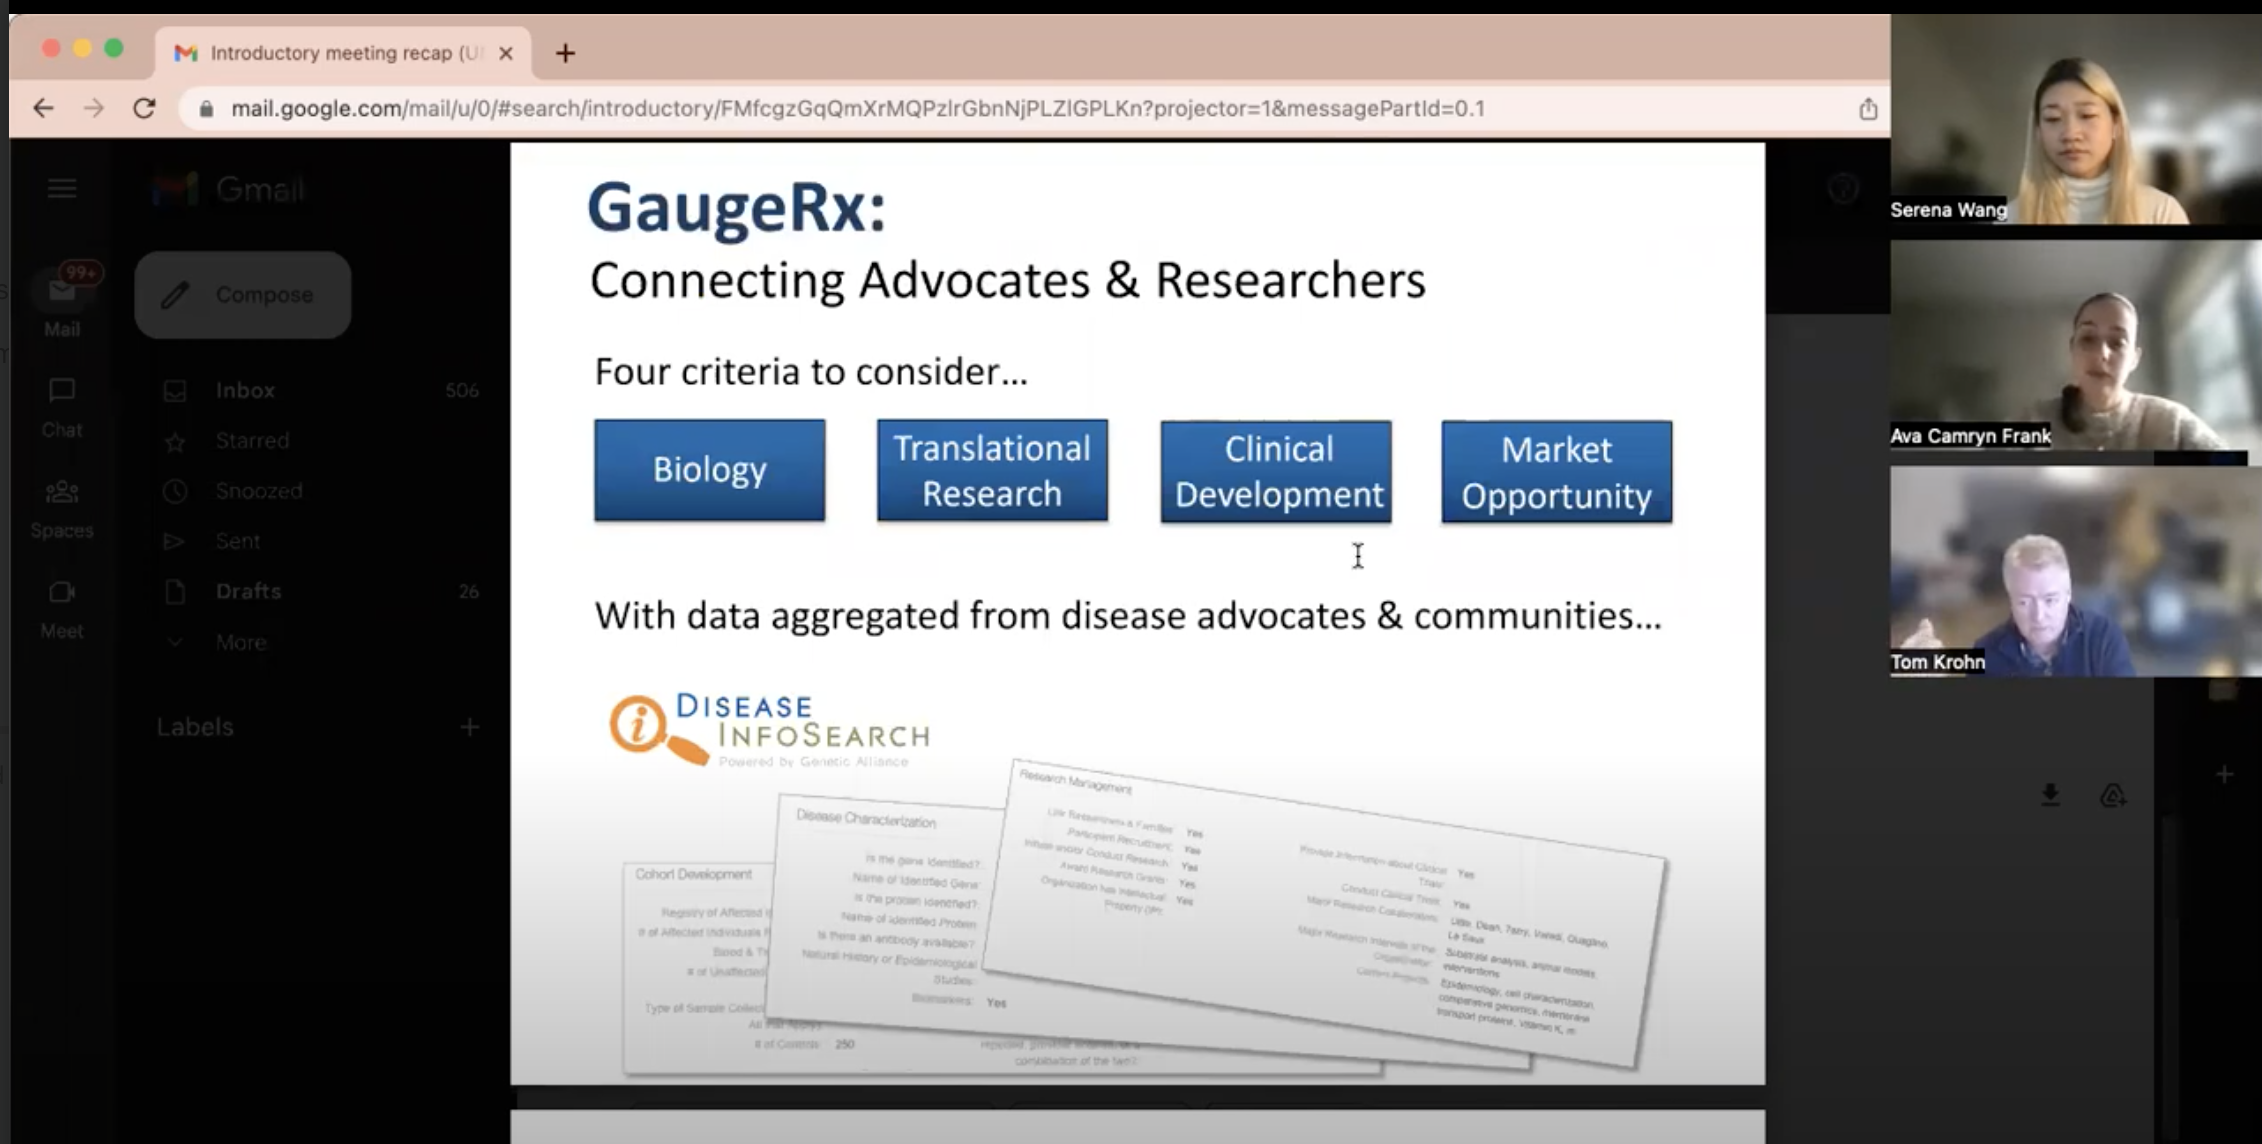
Understand how the four previously identified criteria (provided by client) of Biology, Translational Research, Clinical Development, and Market Opportunity affects a researcher’s decision making when selecting a disease.
02 RESEARCH SUMMARY
The slow-moving world of science
4 industry researchers, 1 academic researcher, and 4 advocacy group leaders later..
These nine research session gave us practical, anecdotal evidence of frustrations within the scientific and medical community.
-
General Questions
How do you currently prioritize which diseases to research? If you don’t currently (or never did) do that, how would you suggest this be done?
What aspects about a disease do you think are important and how do they allow you to prioritize research?
What digital tools/resources does this involve?
Are there any pain points you currently experience during this process?
Criteria Specific
In the context of disease research, can you please define each of the following in one sentence as you feel this pertains to you and your research? Is there another domain/criteria you wish was available?
Let’s say you have to rank each of the criteria while searching for a disease. How would you rank them and why? Do you consider them all equally important?
What does it mean to you if a disease scores low for each criteria? What if it scores highly? How would you make a decision between diseases with high and low scores and what does this tell you about that disease?
-
General Questions
How do you think researchers currently prioritize which diseases to research?
What information or resources do you think they look at?
What digital tools/resources does this involve?
What kind of information or resources do you wish they could have?
What aspects about a disease do you think are important and how do they allow prioritization?
Are there any pain points they or you currently experience during this process?
Criteria-Based Questions
Define the 4 criteria to the advocacy leaders
When researching or having someone research your disease, how do each of the 4 criteria serve you?
Is there another domain you wish was available?
Consider each of the criteria: how do each of these help researchers select which disease to research.
What do you think it means to a researcher if a disease scores low on the biology criteria? What if it scores highly? (Ask this question with each of the four criteria)
For each criteria, what information would you want to be displayed in the tool?
01
Diversity of Resources
Researchers use many types of resources: public databases and journals, specialized resources such as workshops and known experts, and competitive analysis.
02
Lack of Access and Availability
Generally, with rare diseases, there is an issue of data availability already which may or may not negatively impact a disease from being prioritized.
03
Rationale is Crucial
Perhaps the most critical finding to inform our design, researchers voiced needing to understand the scoring for each criteria behind GaugeRx, seeing why a disease was ranked in the particular way it was.
Researchers come from different backgrounds with varying problems in their process that are hard to generalize. Regardless, they all want to know the reasoning behind the tool’s output.
Interviews with 5 researchers (industry and academic) and 4 advocacy groups led us to uncover three main insights that informed our design through affinity mapping:
03 IDEATION & DESIGN STRATEGY
Considering our findings, how should we create this tool?
Idea 01: Let’s find our perfect match 💍


Similar to a dating app, we explored in lo-fidelity some approaches where the user would answer a series of questions, and then is presented with a list of diseases that match their responses.
While this approach maintained a principle of personalized, it would have been impossible to create a set of results pages that outlined all of the nuances and possibilities available.
Since we were matching the inputted answers to DiseaseInfoSearch’s database, this exploration would require us to recode the database based on tags corresponding to our questionnare. We didn’t have time for that.
Due to scope, we had to rely on the four criteria given to us instead of reinventing the wheel.
Technical constraints led us to focus on designing with a numerical system in mind.

These explorations play with how a user could still input their preferences while selecting from a rigid set of four different search filters.
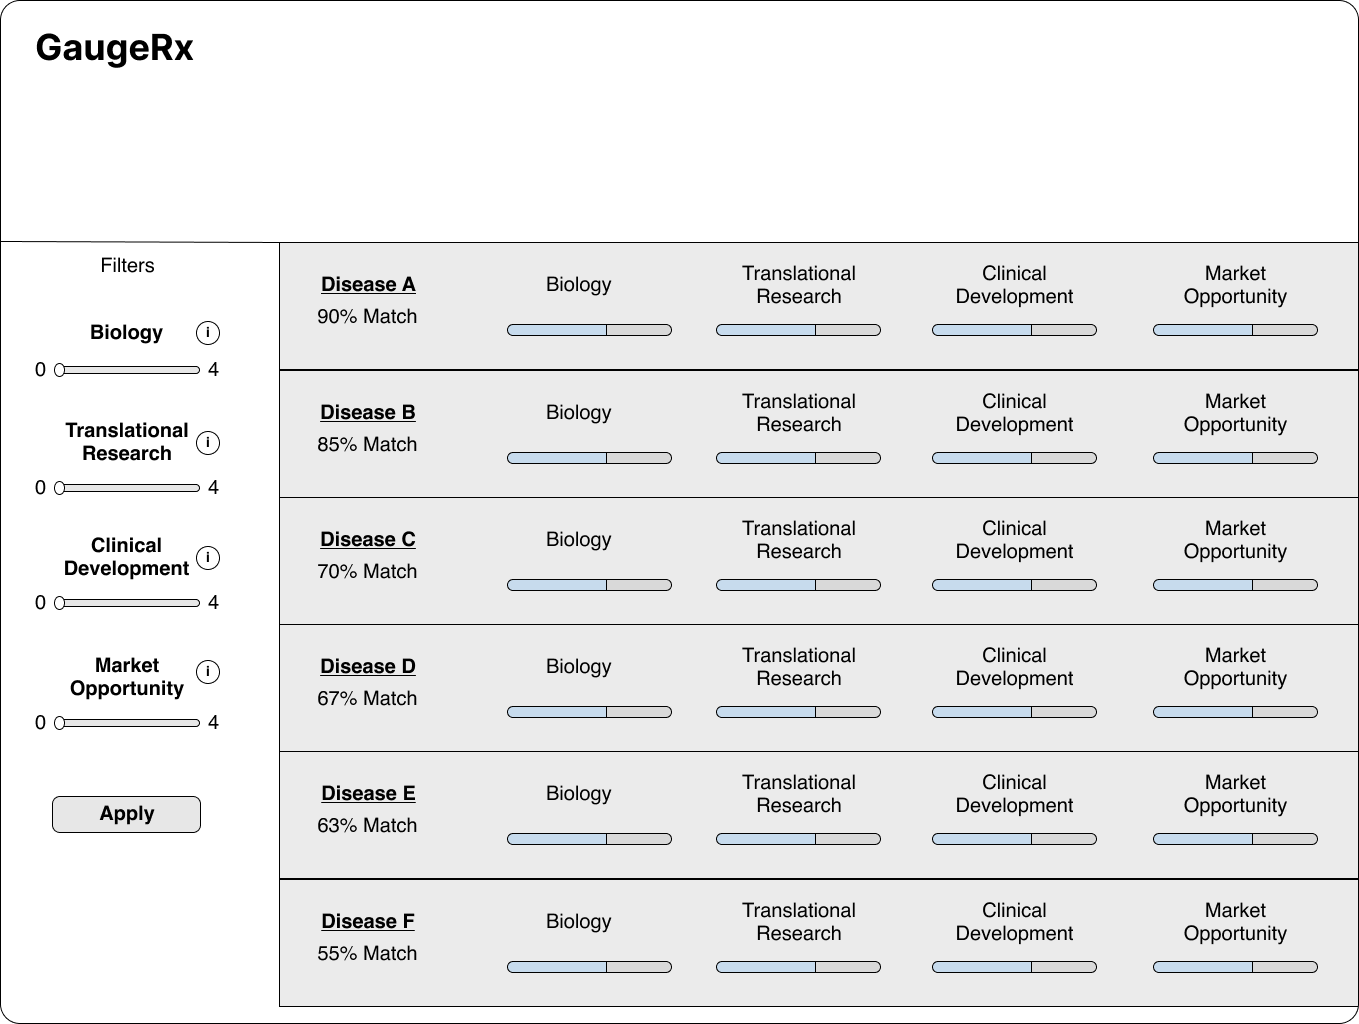
This iteration relies on a numerical system, which aligns with the database that DiseaseInfoSearch is coded in. From there, we designed the first iteration of a results page which displays the best match at the top, along with the fit of each of the four criteria.
This results page was an attempt at giving researchers the most important information to make their decisions (ie: displaying the top percentage match #) without inundating them with other criteria-specific numbers. A table-based format is also a familiar and structured way to interpret information.
How can we show a disease’s overall compatibility?
We knew we wanted to design with more data-points available, but also wanted to mitigate information overload. We started by exploring a visually-centered ring display modeled after Apple’s activity rings. This design was meant to separate the criteria visually while still being informative to the overall result.
The correlation between the rings and the overall percentage match confused users more than it helped them interpret their results.

Let’s pivot (slightly).
We rolled them out to a more recognized format of horizontal bars and tested between options.
We learned that researchers liked having an overall match number highlighted, but said that this percentage was not helpful unless they could see how this information was gathered.


This led to two key developments: 1) the hover card interaction, which displays what is missing from the disease and 2) the pop up, explaining how to interpret the card.
Evolving the design into a higher fidelity, I created two visual systems with distinct personalities.
After receiving feedback on each, we decided to pursue the Traditional style. Preference testing revealed that a tool you could trust was the most important thing researchers wanted, and the different colors of Playground’s palette ultimately meant different things to different people.


FINAL PRODUCT